
Reverse osmosis (RO) systems offer power plant owners and operators a reliable and well-proven water treatment solution. However, designing and caring for an RO system requires a thorough understanding of a plant’s water supply and the technology’s capabilities. The final article of this three-part series will address RO system operation and maintenance best practices.
Section one and two of this article series discussed some of the Design and Upstream Treatment issues in preparing for a new RO system design. This final section will expand on design issues as related to the RO system hydraulics. This will then lead into how to optimally operate an RO system to take full advantage of those hydraulics in reducing the membrane fouling rate by suspended solids. This article continues with a discussion of the critical RO operating parameters and how to convert their values into performance variables that can be used to gauge when to clean an RO system, and concludes with optimum procedures for cleaning the RO system.
Key RO System Staging
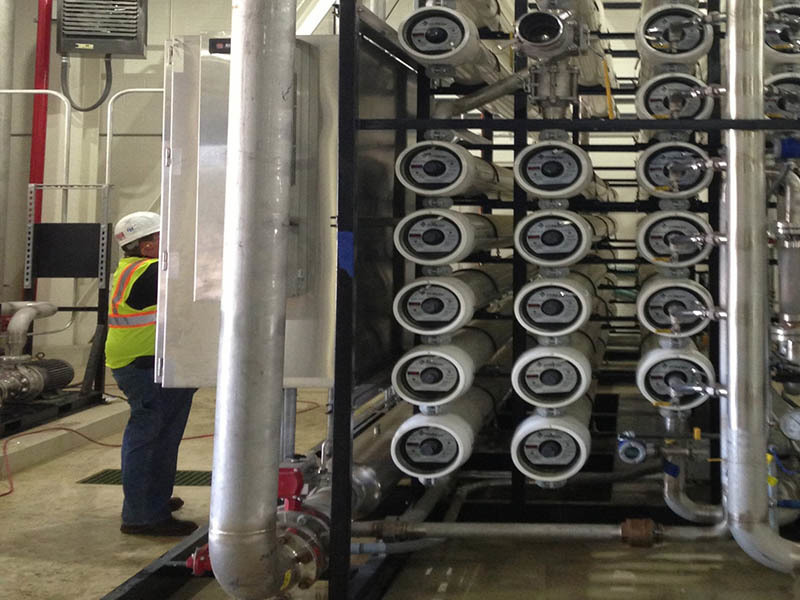
Large RO systems include a number of membrane pressure vessels, which are staged so that the concentrated salt stream from one set of parallel-plumbed vessels is plumbed into a smaller number of membrane vessels, then possibly plumbed to another stage with an even smaller number of vessels (Figure 1). This staging is based on maintaining flow velocities sufficient to keep suspended particles moving and to assist dissolved salts in diffusing back into the bulk stream from the membrane surface.
RO systems are usually operated by adjusting the membrane feed pressure as needed to achieve the desired RO permeate flow rate. This may be done with a variable frequency drive (VFD) to control the high-pressure pump motor’s rotational speed, or by using a throttle valve located directly downstream of the pump. With VFD control, the adjustment may be automatic. The RO system also has a concentrate stream throttle system to achieve the desired concentrate flow rate. This may be a fixed system that uses an orifice plate, or more commonly a manual or automatic valve.
Along with the permeate and concentrate flow meters, pressure sensors are installed in the system piping to monitor the pressure entering the membrane elements, the concentrate pressure exiting the membrane, and possibly the pressures within the plumbing manifolds that connect the membrane vessel stages. A permeate pressure sensor may be needed, especially if there is significant or variable permeate backpressure on the system.
The electrical conductance of the water streams is used to monitor how well the RO is removing dissolved salts. The RO permeate water conductivity is monitored along with the makeup water conductivity. A percent salt rejection for the system is calculated by subtracting the permeate conductivity from the feed stream conductivity and then dividing this value by the feed conductivity. The salt rejection percentage is probably the most commonly monitored performance variable.
Additional instruments (Figure 2) may be needed if there is variability in the feedwater characteristics, or if a chemical is added. If the water acidity changes naturally or through chemical addition, then the water pH should be continuously monitored. The pH can have a dramatic impact on the RO salt rejection. If chlorine is being removed upstream, an online chlorine monitor or possibly an oxidation-reduction potential (ORP) monitor may be used to warn against its presence.
Key RO System Variables
Monitoring the percent salt rejection is important, but is limited in its ability to show the state of the RO membrane and is generally not a good gauge of membrane fouling or scale formation.
The relative ability for water to permeate the RO membrane can be tracked (Figure 3) using a variable called the normalized permeate flow rate, which is the RO permeate flow rate standardized for the effects of operating pressures, dissolved salt content, and water temperature. The feed-to-concentrate pressure drop tracks the resistance to water passage through the flow channels of the various membrane elements. This value may be calculated for the entire RO vessel array, or if inter-stage pressures are available, it can be calculated for the individual vessel stages. If flow rates are not kept constant when operating the RO, it is necessary to standardize the pressure drop for the effect of changing flow rates in calculating normalized pressure drop values. This then allows direct comparison of these values over time regardless of whether any flow rates have changed.
Small suspended particles or salt particles that coat the RO membrane surface can cause the RO normalized permeate flow rate to decline (Figure 4). Larger particles that get caught within the membrane flow channels and subsequently block the flow will cause the normalized pressure drop to increase.
If something in the water is chemically reacting with the RO membrane, the effect will likely be apparent in the normalized permeate flow rate, and possibly in the salt rejection. For example, if chlorine is allowed to come into contact with the RO membrane, the extent of membrane oxidation is apparent as an increase in the normalized permeate flow rate, soon followed by a decline in RO salt rejection.
A thorough understanding of the state of the RO system can be gained by routinely calculating and graphing the salt rejection and the two normalized performance variables, though their values may be misleading if any of the instrument readings are inaccurate. It is critical that monitoring instruments be routinely calibrated and repaired/replaced if in error.
Frequency of System Cleaning
Chemical cleaning is a routine requirement for most RO systems; the frequency depends on the effectiveness of the pretreatment equipment. As fouling solids or scale particles accumulate, their characteristics often change and they become more resistant to cleaning. Clay and biological materials tend to compress against the membrane surface and become chemically resistant as water is squeezed out of their structure. Scale formations may change from being primarily calcium carbonate (relatively easy to clean) to calcium sulfate (difficult to clean).
The change in normalized RO performance variables can be used to determine cleaning needs. Most membrane manufacturers recommend cleaning before these variables change by about 15%.
Certain types of fouling solids or scaling salts may have a substantial impact on permeate quality. Aluminum salts may come out of suspension as a fouling particle, only to re-dissolve if the water acidity changes. This can result in increased aluminum passage from the membrane surface through the membrane and into the permeate/purified water. Calcium carbonate scale may leach a relatively high concentration of calcium carbonate through the membrane into the permeate stream and affect the conductivity. Most other fouling solids don’t have a significant impact on RO salt rejection unless the fouling is extreme.
How to Clean a System Membrane
Membrane cleaning involves passing a cleaning solution through the membrane system at conditions that promote the dissolution or delamination of the fouling solids from the membrane surface, or from the spacing material along the membrane flow channels. The optimum solution depends on the particular fouling solids or scale particles, and the relative ability to clean is often limited by membrane chemical tolerance.
Most strong oxidizing agents that are typically effective in cleaning biological solids are not compatible with RO membranes. There are also limits to the pH extremes that should be used. In addition, while higher temperatures increase the rate of cleaning, the solution temperature is limited to less than 105F or as designated by the membrane manufacturer.
The most critical characteristic of a cleaning solution is its pH. Acidic solutions are more effective in dissolving metals and scale formations, while alkaline (high pH) solutions are more effective in removing clay, silt, biological, and other organic solids. Strongly acidic solutions may stabilize biological solids and should not be used as a first cleaning step. Finishing a cleaning with a strongly acidic solution tends to leave the membrane with increased rejection characteristics but reduced permeate flow, while finishing with a strongly alkaline solution has the opposite effect.
The addition of specific cleaning agents often improves the solution’s cleaning abilities. A chelating agent assists in extracting metals from the fouling solids, while surfactants/detergents improve the solution’s ability to penetrate the fouling solids and suspend oily substances. The use of surfactants may reduce cleaning time, but increases the time required for rinse-up.
When the fouling solids cause a flow restriction, increasing normalized pressure drop, high cleaning flow rates (within the membrane manufacturer’s guidelines) through the membrane feed channels cause agitation that assists in breaking up the deposits. When the solids coat the membrane surface and reduce the normalized permeate flow rate, the delamination of these solids is best achieved by cleaning at low pressure, so that water does not permeate through the membrane during the cleaning process, creating a force that holds the solids to the surface.
Achieving a high cleaning flow rate that is balanced throughout all the membrane vessels usually requires each vessel stage to be cleaned separately. This also helps minimize the pressure required to push the solution through the elements. Cleaning solution should be pumped at high flow rates, as recommended by the membrane manufacturer, and pumped at the maximum pressure required to achieve the target flow rate—but this may be limited to 60 psi to reduce the potential for crushing or otherwise damaging the membrane elements.
The solution is directed in the normal feed-end direction of flow and the exiting concentrate stream is then returned to the cleaning tank at minimal backpressure. The flow direction may occasionally be reversed so that the solution enters the concentrate end of the stage when fouling solids are blinding the face of the lead-end membrane elements.
There may be a small flow of permeate that should also be returned to the cleaning tank using a separate line. In spite of its low apparent flow rate, the permeate should never be valved off because this may put certain membrane elements at risk of physical damage.
Data should be recorded during the cleaning process. With membrane surface fouling, it is difficult to gauge when original performance has been restored until the unit is rinsed and operated normally. If the fouling solids were causing an increased pressure drop in the RO, then the cleaning inlet pressure can be used as a measure of cleaning progress. If the pressure keeps declining, the cleaning is still removing fouling solids. If the fouling is severe, it may require a number of hours of circulation before the inlet pressure stabilizes.
Cleaning success is confirmed when the normalized pressure drop and the normalized permeate flow rate return to their startup values. If the pressure drop has not been fully restored, then cleaning solids have likely be left behind within the membrane flow channels. If the permeate flow rate has not been restored, then fouling solids have likely been left behind on the membrane surface. It might be useful at this point to perform a membrane autopsy to learn more about the nature of those solids in order to determine a more effective approach for their removal, and possibly to learn how the fouling by these solids might be minimized.
This section completes this series of articles about the “Design and Care of RO Systems.”.
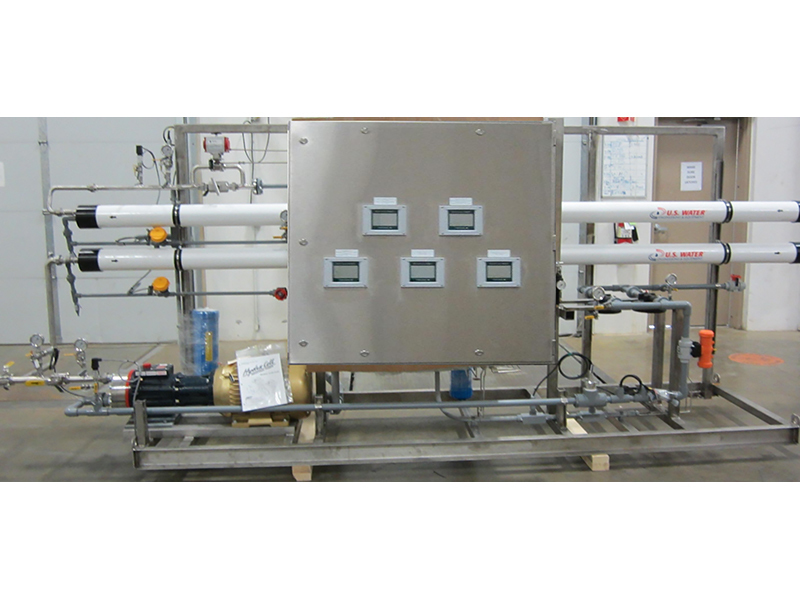 Figure 2: Siting the monitoring instruments. Depending on system location, and its installation configuration, monitoring instruments may be panel-mounted, or mounted directly on system piping.
 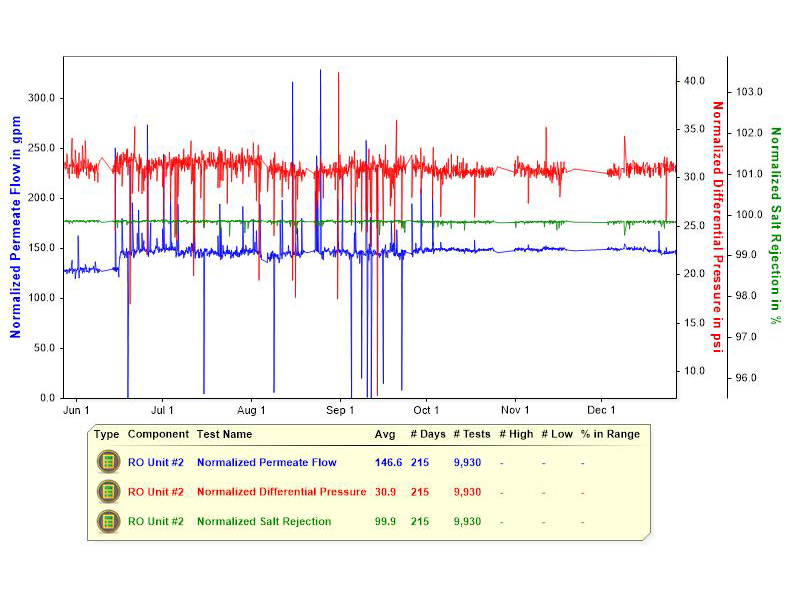 Figure 3: A stable RO system. This graphic shows the performance variables of a stable RO system, with normalized permeate flow, and normalized differential pressure in psi, over a 215-day period.
 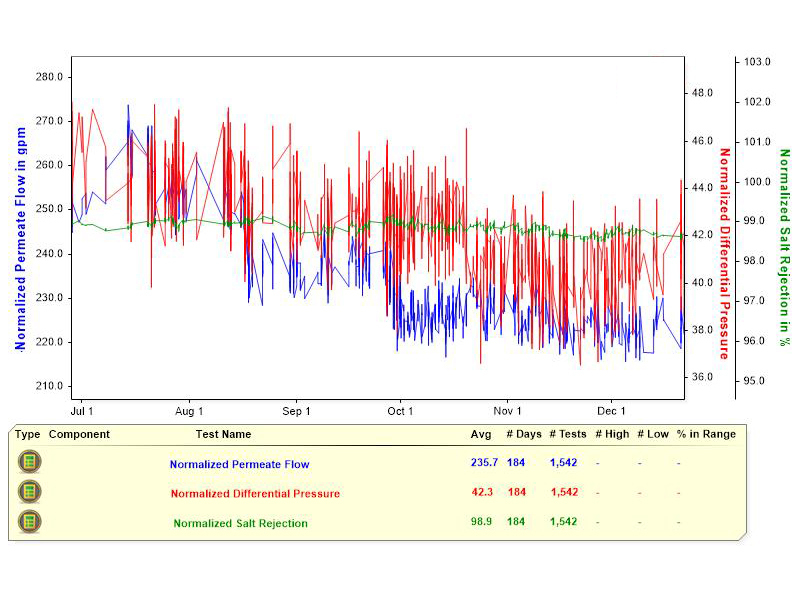 Figure 4: Declining normalized permeate flow rate. This chart provides information about an RO system with a declining normalized permeate flow rate, as tracked over 194 days